- Data Continuum
- Posts
- Lets build your first Streamlit App!
Let's create Your First Streamlit App!
Streamlit is a Python library designed to help you turn data scripts into shareable web applications effortlessly.
Imagine transforming your data visualizations and analysis into interactive apps with just a few lines of code.
Here's an introduction guide to Streamlit with Step by Step Code Explanation
This Streamlit app is a simple yet powerful tool to visualize historical data for selected stocks.

Let's break down the code step by step:
Let's start by installing Streamlit.
Open your terminal or command prompt and type:
pip install streamlit
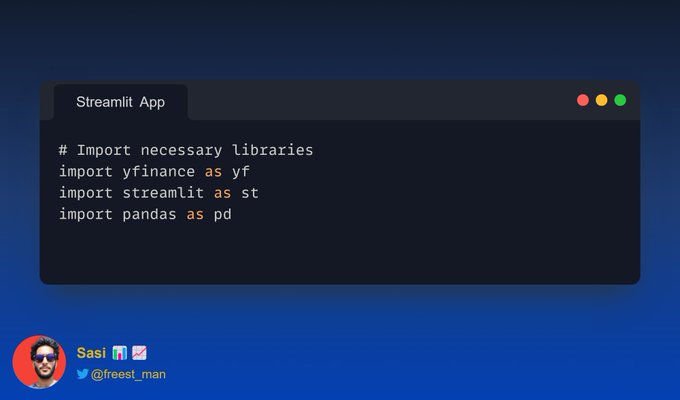
Here are the required libraries that are imported:
yfinance: A library for fetching financial data, used to get stock data.
streamlit: The Streamlit library for creating interactive web applications.
pandas: A versatile library for data manipulation and analysis.

The st.sidebar object is used to create a sidebar in the app.
The header method is used to add a title to the sidebar "Select Stock." get_user_selected_stock is defined to get the user's choice of stock.
It uses st.sidebar.selectbox to create a dropdown menu in the sidebar with options of MAANG Stocks The selected stock is then returned.
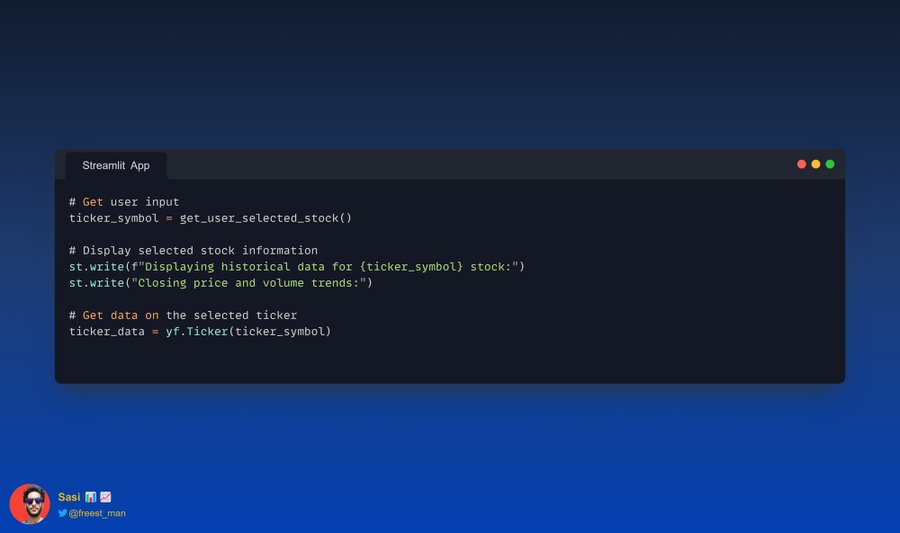
The selected stock is obtained by calling the function get_user_selected_stock.
Using st.write, the app displays information about the selected stock in the main content area.
It shows the stock's symbol and a message about the displayed data.
yf.Ticker is used to create a Ticker object for the selected stock, enabling the retrieval of stock-related data.
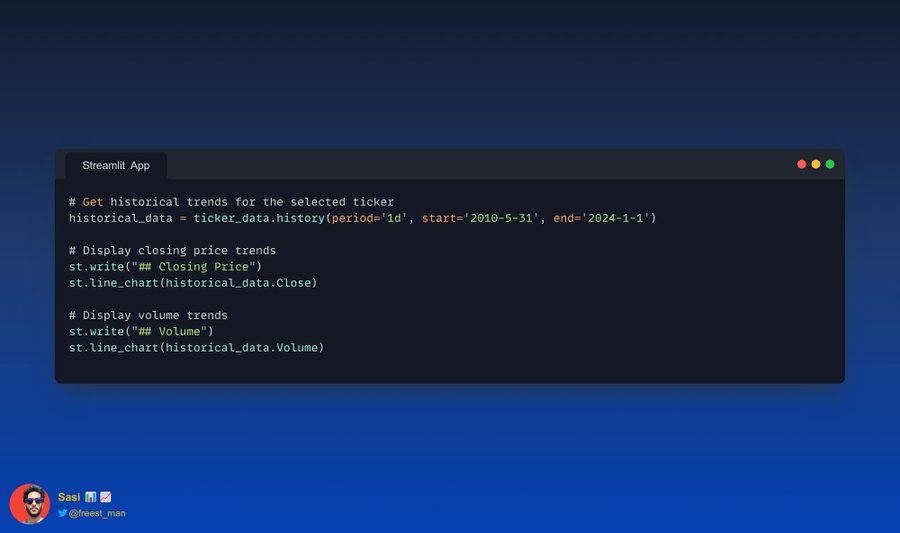
The app fetches historical data for the selected stock using the history method of the Ticker object.
In this case, it fetches daily data (period='1d') from May 31, 2010, to January 1, 2024.
The closing price trends are displayed with a heading using st.write("## Closing Price"), and the line chart is created using st.line_chart with the closing price data.
Similarly, the volume trends are displayed with a heading, and the line chart is created using the volume data.
Here's the Github repo: (Don’t forget to ⭐ if it helps!)
This Streamlit app allows users to select a stock from a sidebar, and it dynamically fetches and displays historical closing prices and volume trends for the chosen stock.
The visualizations are presented in a user-friendly and interactive way, making it easy for users to explore stock data.
Join the conversation