- Data Continuum
- Posts
- The power of choosing the right KPIs
The power of choosing the right KPIs
Sasi SB
January 22, 2024
This is a Dashboard I developed for an actual client.
What’s one thing you noticed first in this Dashboard?
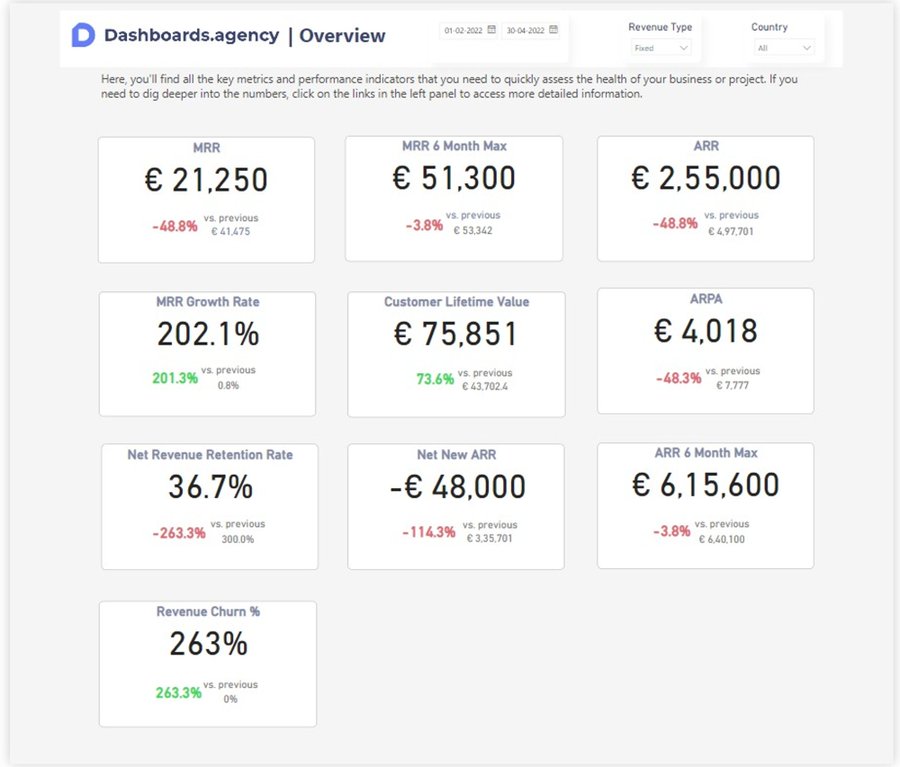
The KPI charts and the KPIs that are being monitored
If you are running a business that requires monitoring a lot of key metrics then this is something perfect for you.
Selecting the right KPIs for your dashboard is crucial for effective data visualization and decision-making.
Here’s the outline of the KPI selection process:
1/ Define Your Goals:
Start by understanding your business objectives.
What are you trying to achieve from the Dashboard?
Whether it's increasing sales, improving customer satisfaction, or enhancing operational efficiency, clarity on goals is key.
2/ Align with Business Objectives:
Ensure that the KPIs directly align with your business goals.
If the goal is to boost revenue, relevant KPIs might include sales growth, conversion rates, or average transaction value.
3/ Crosscheck with the Data:
Check whether the data available can help you track the required KPIs.
If not what kind of features would you need?
How to deal with a certain feature not available for a KPI?
4/ Relevant to Audience
Tailor KPIs to specific roles.
What matters to the executive might differ from the Manager.
Make sure each department sees metrics relevant to its responsibilities.
5/ Measurability and Actionability:
Opt for KPIs that are easily measurable and actionable.
If a metric doesn't offer insights on what actions to take, it might not be the right fit.
6/ Review and Feedback
Regularly reassess your chosen KPIs.
Business goals evolve, and so should your dashboard.
Be ready to make adjustments based on changing priorities.
Gather feedback from the users of your dashboard.
Are the KPIs providing valuable insights? Understanding user perspectives helps refine your dashboard over time.
7/ Visualize Effectively:
Finally, use charts and graphs to present KPIs in a visually appealing way.
This enhances comprehension and makes it easier for users to grasp trends and patterns.
Here is the complete demo SaaS Dashboard
I have linked this so that you can get a better understanding Business Dashboards
Join the conversation